Fair Ways for Statistics: Part 2
Fair Ways for Statistics: Part 2
Propping up the Scratch Scoring Average

David Greenwell (left) interviews Dave Feldberg at the 2012 Memorial Championship. Photo: PDGA
Editor's note: This is the second in a three-part series from Disc Golf Hall of Fame member and PDGA Ratings Committee Chair Chuck Kennedy that explores and analyzes how historic performances can be compared. Read Part 1 here.
By averaging the round scores of our PDGA members with established ratings, known as propagators (props), we have learned how to automatically adjust that scoring average to what our 1000-rated pros would be expected to average on a course. This number is called the Scratch Scoring Average, or SSA, for the course during that round.
Compare the SSAs on two courses and the difference will tell you how many more throws it will take a 1000-rated player, on average, to play the course with the higher SSA than the other. Although some might use the word “tougher” for the higher SSA course, even this improved statistic doesn’t tell the whole story. We must see the differences in how courses play and when they are played to get the most complete picture.
This brings us to a common question on the PDGA ratings process: “Why are scores of players used to calculate the SSA instead of a fixed SSA for the course?” Simple answer: “Where would pre-determined SSA values come from if not from accumulating the scores of players?” This story will take a detour for several paragraphs to fully answer this question before getting back to Paul McBeth’s 18-under round from his year's Great Lakes Open.
Fixing the SSA?
Some feel each of our courses should have a fixed SSA value, like the course index used in ball golf handicapping. A traditional method to determine fixed SSA values would be to collect tournament scores for each course layout until we had enough scores played under a variety of conditions, then calculate and list its average SSA value in the PDGA Course Directory. But this leads to other speed bumps: How many scores under how many different conditions would be enough? Don’t we also need to know who threw what scores to account for the differences in skill between sixth graders and top pros, as discussed earlier? Each score recorded would need to be adjusted to a specific player skill level, so all these adjusted scores would be on the same basis before averaging.
We thought this was the way we’d have to slowly develop the PDGA Course SSA database when creating the rating system. It didn’t take long before we realized that if the adjusted scoring data from each round was good enough to eventually produce a composite fixed SSA value by combining many rounds under a variety of conditions, why wouldn’t using the adjusted round scores in those specific conditions be even better to rate the round you just played?
Of course, we had to confirm that the calculation process worked. The thing is, using dynamic data generated during each round for the course layout and conditions in which it was played (if you have enough propagators) will be more accurate statistically than any fixed number average generated in advance for course conditions that could range from -10 degrees with snow, wind, and leafless trees to 100 degrees with leafy trees and foliage.
The only data needed to generate each round SSA for old, new, and temporary course layouts is contained within the ratings and scores of the propagators. This eliminates difficult problems with establishing SSAs like, “How could you possibly code and track course configurations on courses with multiple tees and/or pins and special OB rules? Or identify the hole designs of temp holes so future tournament directors could look it up?” Even more importantly, with annual course growth over 10 percent, “What SSA would a TD or the PDGA use to calculate ratings when a course layout doesn’t have a value in the directory?”
There’s also a related concern: “If every propagator shoots better than their rating, won’t their round ratings be too low?”
Here’s what we discovered about props: The typical PDGA prop shoots more than three throws above their rating one in six rounds; more than three throws below their rating one in six rounds; and within three throws of their rating two out of three rounds. If you have just five props producing an SSA, the odds that all five will shoot more than three throws above their rating is about the same odds as throwing all sixes in your next roll of five six-sided dice (1 in 7,776). In tournaments with 50, 100, or 150 props, you have a better chance to win the Powerball than see a three-shot drift in the round-by-round SSA calculation due to all props playing more than three shots better than their rating.
There’s also concern about being rated by the propagators who show up at your event. In theory, props of the same rating all over the world are randomly interchangeable; they are like thermometers measuring the course each round by the score they shoot. Certainly each 930-rated prop may have slightly different skill sets producing that rating, but a 930-rated robot would be expected to play like a 930-rated human on any course or it wouldn’t have a 930 rating. Regardless, when enough props are selected randomly, each set with the same mix of ratings should produce SSA values within the same statistical variance when they play at the same time.
45 vs. 45
Getting back to McBeth, we have the rare coincidence where he threw scores of 45 on both the Vista del Camino XL course in the 2012 Memorial Championship and on the Toboggan course in the 2018 Great Lakes Open. The coincidence isn’t just the 45s, but that both courses played to an SSA within a half shot of each other – 57.5 and 58, respectively. If you’ve seen or played both courses, it’s not obvious they would produce the same SSA. But we’re talking about crunching the scoring statistics from the rounds, not how the courses looked.
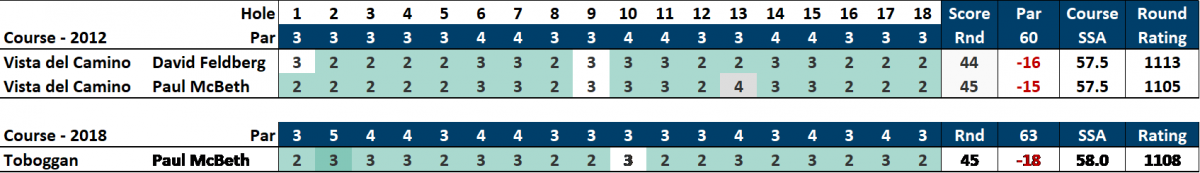
The other coincidence is David Feldberg was playing with McBeth in both events. Feldberg shot a 44, one better than McBeth, that same day at Vista, which is currently the highest-rated round for courses in this SSA range. Another oddity is that Nikko Locastro, with a 44 on the same Vista course a year later, has the second-highest rated round in this category (1111) and was also playing with McBeth when he shot his record round on the Toboggan. The latter round will likely become just the fourth-highest rated round in this SSA category when official.
Getting Down and Murky with the Stats
One of the more popular queries that comes from the baffled minds of many players, including those who have some deeper knowledge of how the ratings process works, is “Why do the rating points-per-throw decrease as the course SSA increases?” We graphed thousands of scores by rated players on courses covering a wide range of SSAs, and simply discovered that players whose ratings were separated by 50 points averaged five throws apart on a 50 SSA course and seven throws apart on a course around a 65 SSA.
This makes sense when you consider that the players are still separated by 50 rating points in skill level regardless of the course. On courses where they average five throws apart, the rating points per throw must be 10 so their ratings remain 50 points apart (five throws x 10 points/throw = 50 rating points). On courses where they average seven throws apart, the rating points per throw must be slightly over seven so their ratings remain 50 points apart (seven throws x 7.14 points/throw = 50 rating points).
We later discovered that ratings work like “shooting percentages” in other sports like basketball: The more shot attempts, the smaller a make or miss changes your shooting percentage. Consider total shot attempts of 54 and 72 just like a 54 and 72 SSA on two different courses. In basketball, each shot made is a “success.” If a player makes 18 out of 54, that’s 33 percent success rate. If the player makes 18 out of 72, that’s only 25 percent success rate. Making one more shot boosts the shooting percentage by 1.2 percent in the 54-attempt series and just 1 percent in the 72-attempt series, i.e., more percent per make with fewer overall attempts.
It works the same way in disc golf, but the scoring is inverted where success is trying to reduce our score below a course’s SSA. When a player shoots a crazy score of 18-under on the 54 SSA course, that’s shooting 33 percent under the SSA. Shooting 18-under on the 72 SSA course, though, is only 25 percent below the SSA. Shooting one more down on the 54 SSA course is a 1.2 percent reduction, but only a 1 percent reduction on the 72 SSA course – the exact same comparison with the basketball example.
This mathematical principle translates into ratings math where shooting one more shot under the course’s scoring average is worth more rating points on lower SSA courses than higher SSA courses. But many observers don’t feel it should be that way, including this writer, when judging exceptional performances. Shooting 15 under the SSA looks tougher and feels tougher on a higher SSA course than shooting 15 under on a pitch-and-putt course.
This perception disconnect resulting from percentage calculations is why our courses have been separated into five SSA ranges, each six shots wide. Courses with SSAs within six throws are more statistically similar and suitable for comparing exceptional performances. Ball golf has reduced confusion in a similar way by limiting the courses played in their tour events to pars in the 70-72 range, with underlying course indexes in about a six-stroke range. In Fair Ways for Statistics: Part 3, we’ll take a closer look at our Best 10 Rounds of All Time ranking list in five SSA categories for men and women.
Comments
I love the rating system that
I love the rating system that is used for player ratings and tournament round ratings, i love how how pt. 1&2 breaks down how the system works .i think they make the best attempt to come up with a fair system for all , and i think its as close and accurate as you can get and need for disc golf. i really love i play in the division my player rating dictates i wish all PDGA am events required a PDGA number to play , i don't think it will hurt the numbers i think these players will join if they are forced to, if they want to play our events and i believe they do.. i know were just playing for plastic but i would like to feel like the players in my division are there by their rating. i am trying to play my way out of my division. sorry i drifted off topic..Love the PDGA.
My experience with the PDGA
My experience with the PDGA ratings system since joining in 2011 is that the ratings system is amazingly accurate. I have also heard the debates about issues with how the rating is calculated and thanks to these articles Chuck we now have somewhere we send players who are having trouble understanding how they are calculated.Well done! The proof to me is shown clearly in team golf where players of wide range of ratings play very close matches far more often then not. It is very common for teams matches to be decided by hand full of throws over the course 12 weekly matches in which 600-700 total shots are played. I also played Ball golf for many years and can say this system is more accurate then PGA handicap system particularly when playing in handicapped events like team golf when the players rating is truly (important) ...Keep up the good work!