Fair Ways For Statistics: Part 3
Fair Ways For Statistics: Part 3
Let’s see: Maple Hill beats Toboggan beats Fountain beats Maple Hill? Throshambo!
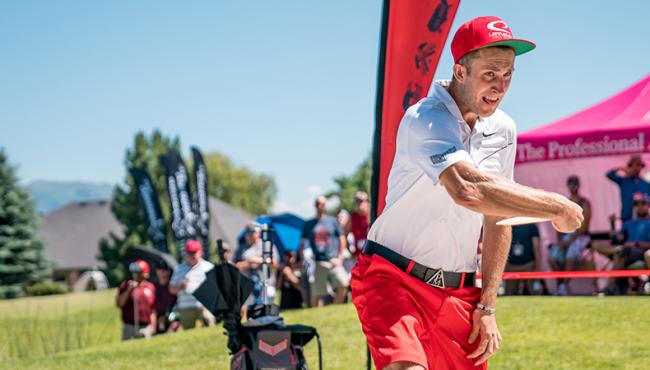
Ricky Wysocki tees off during the final round of the 2018 Utah Open, where he threw an 1109-rated round. Photo: Alyssa Van Lanen
Editor's note: This is the final installment in a three-part series from Disc Golf Hall of Fame member and PDGA Ratings Committee Chair Chuck Kennedy that explores and analyzes how historic performances can be compared. Read Part 1 here and Part 2 here.
Our top men and women have played and set records in all five course SSA categories. We‘ll first determine the best rounds for men and women in each category – including what those rounds looked like to observers – before venturing into discussions about which one you feel is currently the best of all time.
The trap, though, is trying to make fair comparisons when our statistics in different categories are not easy to compare.
Archery or shooting sports, for example, can’t easily compare performance records shot at different distances or with pistols versus long range rifles. Disc golf, likewise, is a target sport at heart, dating back to when the first Frisbee glanced off a tree.
The 3A course category with the 54 to 60 SSA range is one of the most active for tour events and home of the earlier Vista del Camino XL and, now, Toboggan record rounds. Note that it’s never a surprise what score must be thrown to get an 1100-plus rating: A 45 on a course with a 58 SSA has always been rated 1108, and six years earlier was rated 1105 on a 57.5 SSA course. Some viewers seem surprised, and sometimes disappointed, at the ratings, but it can be estimated in advance by looking at the SSA from the previous year or following the live scoring as tee time scores are steadily posted on the PDGA website.
Here are the current top 3 best record rounds in category 3A, along with McBeth’s official round:
| Name | Course | Rating | Score | SSA | Year |
|---|---|---|---|---|---|
| David Feldberg | Vista del Camino | 1113 | 44 | 57.5 | 2012 |
| Nikko Locastro | Vista del Camino | 1111 | 44 | 57.2 | 2013 |
| Ricky Wysocki | Mulligan's Creekside | 1109 | 44 | 56.7 | 2018 |
| Paul McBeth | Toboggan | 1108 | 45 | 58.0 | 2018 |
| Paul McBeth | Vista del Camino | 1105 | 45 | 57.5 | 2012 |
The 44 versus 45 scores and 1113 versus 1108 rating stats might say Feldberg, Locastro and Wysocki win this comparison, but not necessarily the actual performances we observed. There’s a hidden “bonus” built into some SSA values that hasn’t been officially recognized, at least for record-establishing purposes: The field of players on Vista del Camino had two to three penalties on average in each round in their SSA scoring average (based on recent penalty stats on this course layout; they weren’t tracked in 2012). Mulligan’s Creekside had four to five penalties on average in each round in its SSA scoring average. Toboggan had virtually no penalties (0.1) in its SSA scoring average.
O.B. Careful
“Penalty padding” to boost the perceived difficulty of a course – and, consequently, its resulting SSA – has become more common in the past 10 years. Temporary courses are set up for tour events, sometimes on ball golf courses, with natural and artificial hazards being marked OB or given punitive drop zones. In addition, one or two mandatories might be added – some without nearby drop zones – so players have to re-throw from their previous lie, tacking on the equivalent of one more penalty with the loss of distance.
Although these hazard elements are legal within the rules, using them – especially the more punishing ones – can produce scores where even the best players cannot reasonably avoid a penalty or two, three, four, or more each round. This trend is producing a new disc golf variant that’s diverged from traditional course design, where trees and foliage have been the primary challenges equivalent to rough and sand traps in ball golf. In discussing this recently with Feldberg, we came up with the terms “shot landing control” versus “shot shaping control” to characterize the new elite course design variant from traditional course design.
Which challenge do you believe is tougher: controlling shot landings, or shaping a route? Shot landing areas can be blind, and it’s unclear how the surface will respond for skipping and how much the wind will reposition your desired landing zone. For shot shaping, it’s usually easier to see what obstacles you must throw around or over. Developing different throwing skills to effectively shape the different types of routes required will be useful compared with mostly forehand or backhand hyzers on open courses with lots of OB where shot landing is at a premium.
“It's probably better than the ratings show...Those shots aren't easy, especially the par 3s.”
– Paul McBeth on his Toboggan round
If we conservatively deduct just two penalty throws from the Vista SSA, dropping it from 57.5 down to 55.5, Feldberg shot 11.5 throws below this adjusted SSA (55.5-44=11.5). Wysocki shot about 8.5 throws below adjusted SSA (56.7-4.2-44=8.5). The Toboggan SSA only had 0.1 penalty throws, so McBeth shot 13.0 throws below SSA (58.0-45=13.0). If we apply this new statistical approach, McBeth would hypothetically be leading SSA category 3A along with what many perceive was a better performance.
What Are the Odds?
We now have one McBeth round hypothetically topping the chart in course category 3A and three McBeth rounds topping the charts in categories 2A, 4A and 5A – with Ken Climo topping category A – to potentially consider for best all-time performance. There’s one more stat to consider that might help. What are the odds that a specific player would shoot a round that low? We can calculate how many standard deviations a player’s score is below the score we’d expect them to shoot based on their standard deviation and their rating at the time.
Here are the odds for the current top men and women in each category to shoot these record rounds in relation to their rating at the time they threw the round. For reference, McBeth’s and Willie Prince’s Toboggan rounds are also included for comparison.
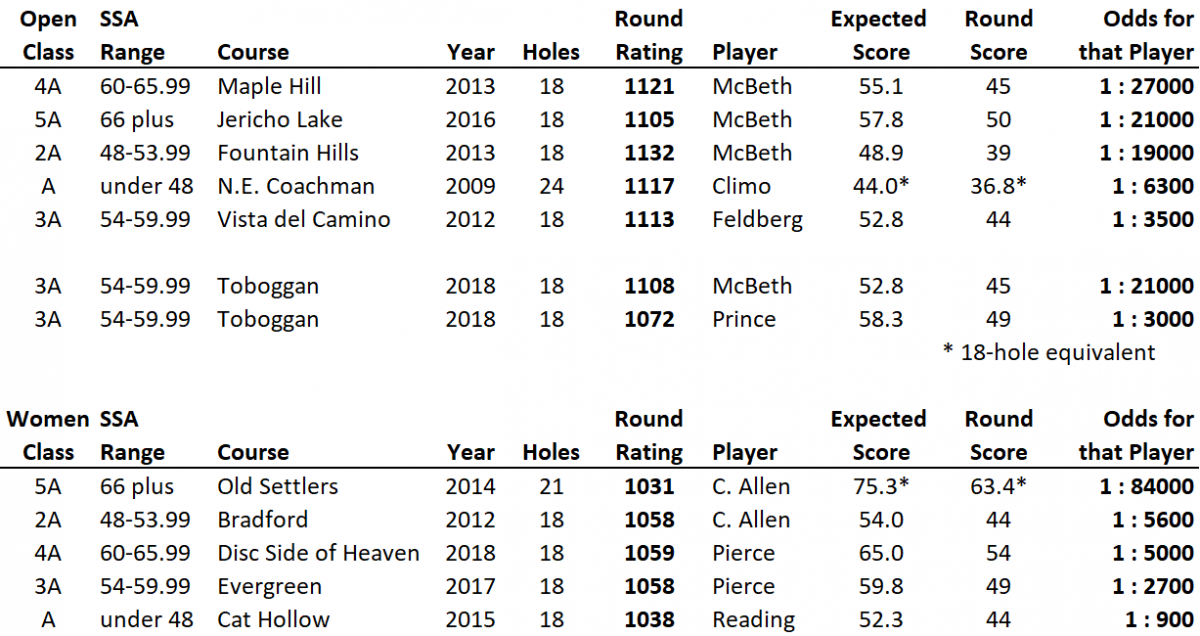
Many have felt McBeth’s round at Maple Hill was more impressive than his rating-record round at Fountain Hills, and now we have the Toboggan round for comparison. All top rounds are in different SSA rating categories, so comparing rating stats alone isn’t ideal. The odds that McBeth would shoot that low of a score on that course at that time is another way to compare rounds in different SSA categories.
The odds of McBeth shooting the 45 at Maple Hill edges out both his Jericho Lake and Fountain Hills rounds, but it’s close. When you’re comparing extreme performances with standard deviations above three, the slightest variance can change the odds by several up to 10s of thousands. We can see the Toboggan round matches his Jericho Lake round using this personal odds comparison.
Catrina Allen produced the highest odds in any category for men or women with her Old Settler’s round in 2014; it was on a 21-hole layout that had to be adjusted to an 18-hole equivalent for comparison. It’s difficult to compare male and female records using odds because women have more room between their expected score and their lowest potential round.
For example, Ken Climo’s expected round of 44 on that N.E. Coachman layout based on his rating at the time was already 10 under “normal” par 54 before he even threw that course. He didn’t have much room to shoot lower to get the record. Des Reading had a similar challenge for her Category A record, but with a bit more scoring room than Climo.
You Make the Call
What’s an observer who’s interested in record rounds supposed to make of all these stat comparisons? Even as a stats guy, I fully believe we must turn to those who observed the rounds to rank their overall historical performance.
“I’ve watched both rounds and Paul’s round today is much more impressive than his round at Fountain Hills.”
– D.H. commenting on McBeth’s Toboggan round (Facebook)
We now have course examples with stats in each category. Those who watched McBeth might want to rank the Maple Hill round the best. Statisticians might want to go with the numbers and give Fountain Hills the nod. Even though Feldberg’s full round wasn’t recorded on video, here are some highlights from the Disc Golf Guy. Traditionalists may find the Champ’s 23 straight birdies after parring the first hole the most impressive round.
At least for men, McBeth is dominating the longer, tougher course records. Wysocki does have rounds in the top 10 in categories 2A, 3A, and 4A, but none in the top spot yet. Which of McBeth’s rounds you like best is your call. You can use some of the stats to support your argument, but how the performance looked is really the bottom line for each person.
“Definitely like a video game...with cheats enabled. Lol”
– R.F. commenting on McBeth’s Toboggan round (Facebook)
For the women, I think Paige Pierce’s round this year may have been the only one captured on video for players to review. Catrina Allen’s round on Bradford in 2012 was memorable partly because it was in the massive Charlotte Worlds event with around 1,200 players, and because Michael Johansen also shot a Top 10 record round on the Bradford course.
Personally, I’m with Switzerland: neutral on which performance was best. I think there’s still some room to improve in all of our category performances even if a player shoots the same low score again. Throw a few unexpected rollers. Toss in a few JohnE McCray turbo putts from 80 feet. Launch a Schwebbie thumber over some tall trees. Do all this and shoot 45 at Toboggan or Maple Hill? Now that’s entertainment.
Epilogue: Where Do We Go From Here?
For comparison, I was curious about penalty stats in ball golf. The Professional Golf Association doesn’t track penalties directly, but it’s possible to derive penalty stats from the other PGA Tour stats they produce. Also, golf media will sometimes track penalty stats on controversial courses like TPC Sawgrass with its infamous island hole 17 (which inspired our hole 17 design at USDGC). Even with the island hole and half of the holes with water in play, competitors only average one penalty every two rounds on the TPC Sawgrass course during The Players Championship, their fifth Major by some accounts. This course typically has the highest rate of penalties on the PGA Tour, where penalties among the top 200 players average closer to two every five rounds.
Compare that with our emerging temporary elite course designs, with the Lake Eureka course at the Ledgestone Insurance Open and the Emporia Country Club at the Dynamic Discs Glass Blown Open producing five to six penalties per round (per UDisc Live tracking). This penalty rate is about 10 times higher than TPC Sawgrass, which is already considered too punitive for traditional golf by many stakeholders in the ball golf world.
The penalty average per round was even higher for women in some events, where women averaged more than one penalty per player on just a single hole! Our true penalty average on these elite courses is even higher when you consider most drop zones are located so far back that it’s 99 percent likely a player’s score will increase by one more throw.
I was initially shaking my head along with other designers and pros who have looked at our significantly higher penalty stats versus traditional ball golf. Rather than consider these open temp courses with OB everywhere as a poor design choice, though, a more enlightened view would be to consider playing these courses as a new disc golf variant primarily found in elite events. However, the unfortunate side effect is an increasing concern that tournament directors in lower tier events will tortu… – I mean challenge much lower rated players, and even beginners, with these difficult OB design elements, producing double-digit scores and more lost discs.
This new disc golf variant would ideally become established as a separate course design category with its own course and player ratings. That seems like a better way to handle this emerging format moving into the future versus providing no ratings at all (as we’ve done for several events with extensive OB hazards plus throw-and-distance penalties (USDGC)). A separate stats question would be whether to extract penalties from the tournament SSA values to get a better representation of the course difficulty for comparisons to courses with few or no penalties like Toboggan.
“Pro Worlds 2018 features Brewster Ridge, a traditional wooded course with minimal OB, and Fox Run, an example of the proposed Elite course variant with extensive OB equivalent to the USDGC.”
Another item to consider is developing a new metric to track performance during tournament coverage in tandem with “over/under par.” Even though par values might sometimes be inflated, the over/under par stat remains familiar to the public. This proposed dynamic metric would compare player scores in relation to the accumulating expected scores on holes as players progress through the round. It would give a better live indication of overall comparative performance to supplement statistics focused on a specific part of a player’s game, like putting percentages and greens in regulation.
Some of these ideas are new for the PDGA to consider, and some continue to be discussed within PDGA committees. We hope, and know, some of you will trigger further discussions on these important topics in social media posts and blogs. We’ll be reading, listening and watching.
Comments
Great write up with plenty to
Great write up with plenty to consider from a statistics standpoint. We all have our own opinion on the greatest round ever but it's usually a round we have seen in person or on live/post production coverage (thanks to those who make the video coverage possible). What you have presented is a logical way to compare rounds from different eras of disc golf. Thank you for presenting this to the public. I hope it sparks debate within the PDGA! Now to read parts 1 & 2...